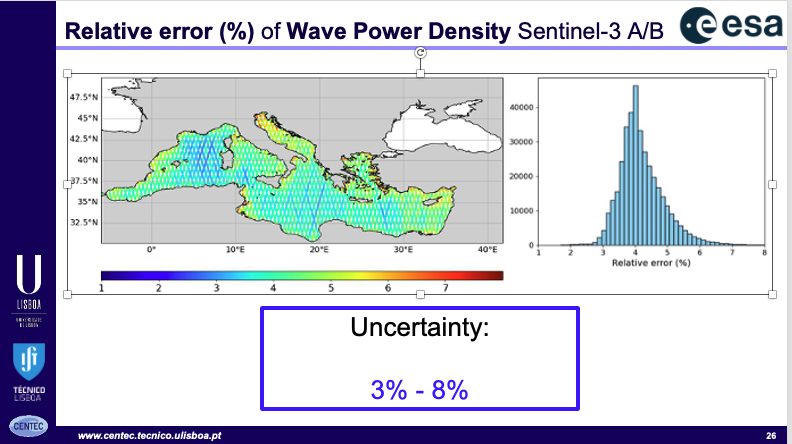
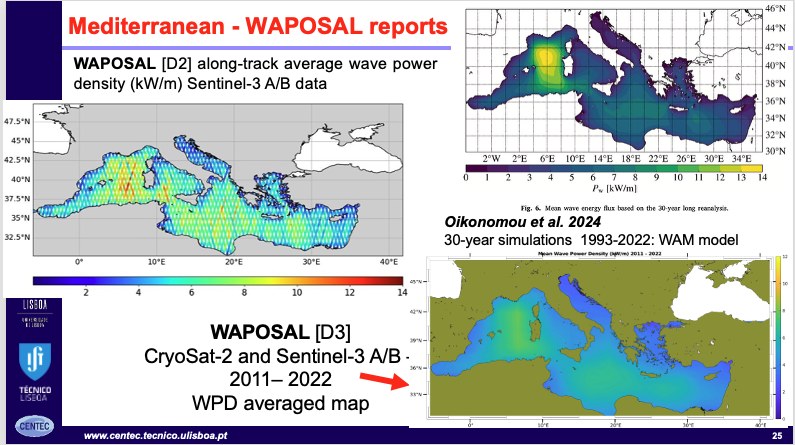
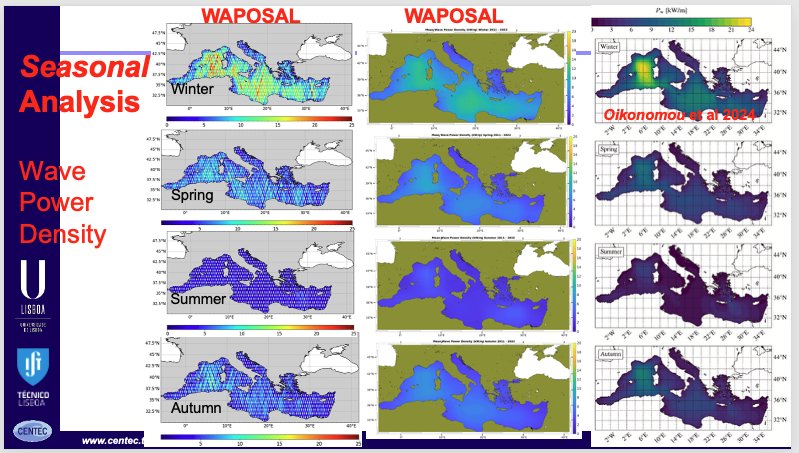
The WAPOSAL project produced results of crucial importance for the extraction of wave resources along many coasts. The developed WAPOSAL method provides the wave power density with uncertainties ranging from 1.5% to 9% (Final Report, Section 8). An example is shown in Figure 6 for the Mediterranean. The highest uncertainty is found in the Adriatic Sea and nearby coasts.
Figure 2 illustrates the along-track distribution of wave power density in the North of Spain using Sentinel-3 A/B.
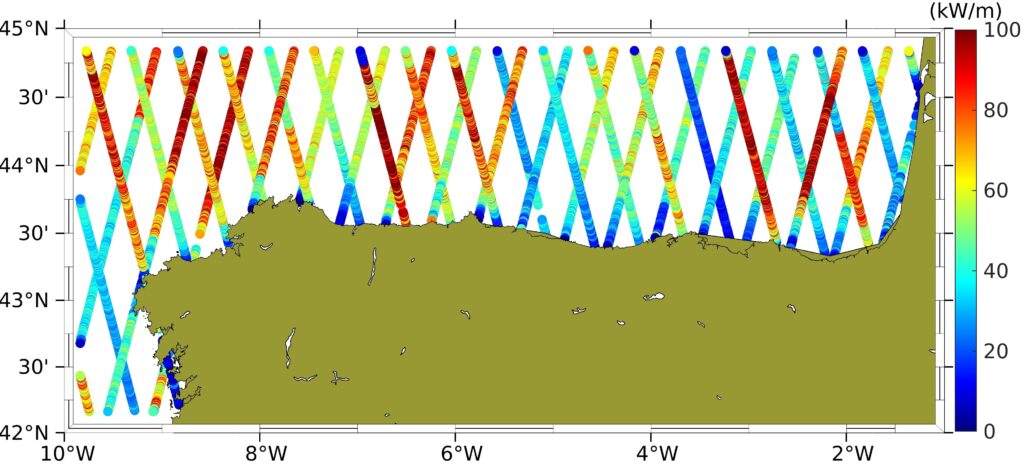
Figure 2. Average Wave Power Density along-track Sentinel-3 A/B (2016-2023) for the Spain Atlantic coast (all December).
The influence of ocean currents on the wave energy flux is one of the subjects that deserves attention. Figure 3 shows a comparison along-track (CryoSat-2 mission) between the ocean current (IBI product) and the wave power density (top panels). The simultaneous wind and wave fields (bottom panels) are taken from the ERA5 reanalysis. The comparison shows a high correlation (Correlation Coefficient = 0.96) between the current and the wave power density and that the current can influence the wave power density.
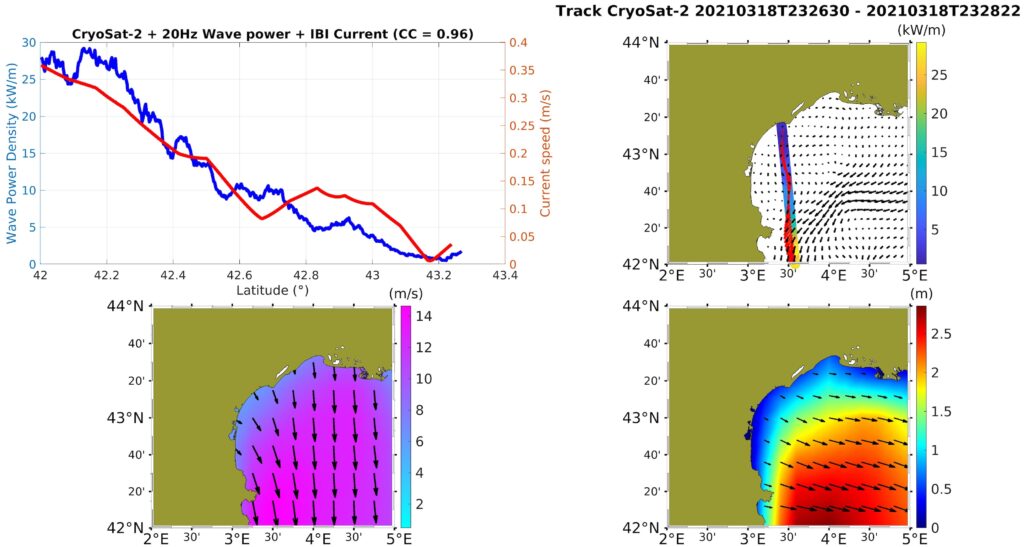
Figure 3. Comparison of the wave power density and ocean current along the CrysoSat-2 track in the Gulf of Lyon, Mediterranean. Date: 18 March 2021.
Validation of the Gommenginger method
To obtain the wave period necessary for estimating the wave power density, we apply and improve the empirical method of Gommenginger et al. (2003), assessed at 124 locations utilizing “real” wave buoys (82) and ERA5 “virtual” wave buoys (42) for eleven regions shown in Figure 1. The Mediterranean Sea is displayed below as an example in Figure 4.

Figure 4. The Mediterranean Sea and the location of wave buoys.

Figure 5. Scatter plots for significant wave height (m) (left) and wave period Tz (seconds) (right) for the wave buoy 6100106 in the Western Mediterranean and Ancona, Italy.
Figure 6. Uncertainty of Wave Power Density in the Mediterranean Sea (2007-2022).
